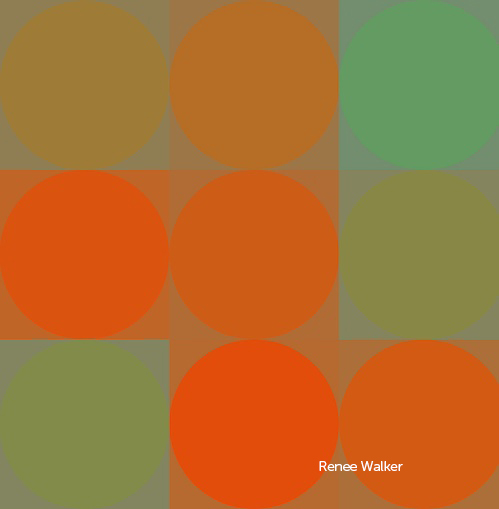
Temperature Quilt
Temperature Quilt utilizes the P5 Java creative coding platform to showcase real-time thermoreceptive data from six global cities. The data is represented by a spectrum of colors, ranging from orange-red (hottest) to blue-green (coldest), within the color-light spectrum. Each grid field displays a city with the 'current temperature' as the background and the 'feels like' temperature as the foreground. Additionally, this visualization technique aims to highlight global temperature warming. The cities, listed from left to right and row by row, are: Boston, Philadelphia, Chicago, Phoenix, Los Angeles, Seattle, Paris, Dubai, and Melbourne.

